Coverage icons
You must be logged in to download this presentation.
Try Before you Buy Download Free Sample Product
 Impress your
 audience
Editable
of Time
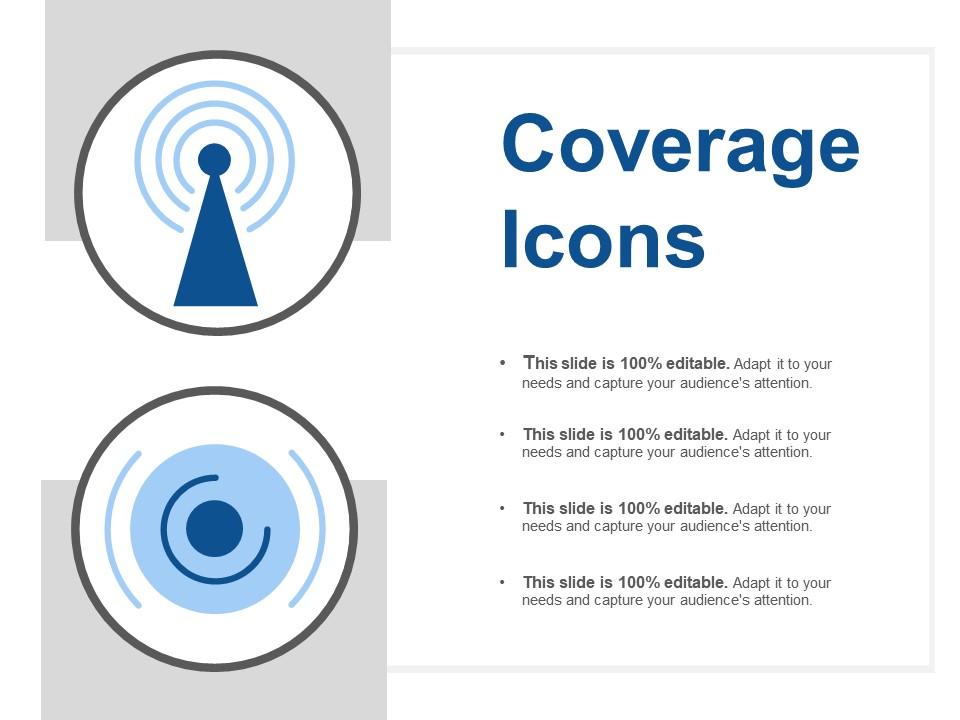
Measure the company’s ability to meet its financial obligations by using the Coverage Icons slideshow. Mention how the asset coverage ratio is used by the company. This PPT slideshow will help you to understand the asset coverage ratio in an easy way. Measure how well a company can cover its short term debts with its assets using the coverage ratio PPT layout. Also, give your audience an understanding of the debt-service coverage ratio using this visually appealing PPT layout. Demonstrate the method to calculate debt to asset ratio on the balance sheet with the help of asset coverage ratio PPT visual. Make full use of the high-grade icons present in the slide to make your presentation attention-grabbing and meaningful. You can easily depict the sales pertaining to different months and present it in front of investors and other stakeholders via this financial statement PowerPoint layout. Formula to calculate the fixed asset coverage can be depicted using this attention-grabbing PowerPoint template. Download the template now and evaluate changes in assets, liabilities, and equity.
People who downloaded this PowerPoint presentation also viewed the following :
Looking for something specific? Start your search below.
Coverage icons with all 5 slides:
Blend creativity and content with our Coverage Icons. They contain the best of both.
-
Innovative and Colorful designs.
-
Great product with effective design. Helped a lot in our corporate presentations. Easy to edit and stunning visuals.


