Powerpoint Templates and Google slides for Analysis Bar Graph Icon
Save Your Time and attract your audience with our fully editable PPT Templates and Slides.
-

Md eleven staged bar graph with icons business analysis powerpoint template slide
Presenting md eleven staged bar graph with icons business analysis powerpoint template slide. Eleven staged bar graph and icons has been used to craft this power point template diagram. This PPT diagram contains the concept of business result analysis. Use this PPT diagram for marketing and business related presentation.
-

Ng ten staged bar graph with icons business analysis powerpoint template slide
Presenting ng ten staged bar graph with icons business analysis powerpoint template slide. Ten staged bar graph and icons has been used to craft this power point template diagram. This PPT diagram contains the concept of business result analysis. Use this PPT diagram for marketing and business related presentation.
-
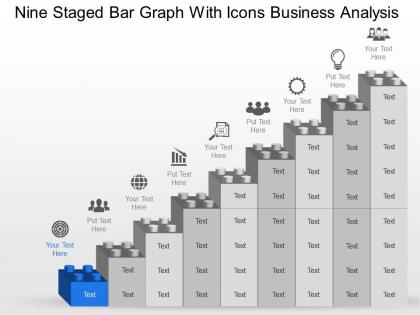
Mu nine staged bar graph with icons business analysis powerpoint template slide
Presenting mu nine staged bar graph with icons business analysis powerpoint template slide. Nine staged bar graph and icons has been used to craft this power point template diagram. This PPT diagram contains the concept of business progress analysis. Use this PPT diagram for sales and business related presentation.
-
Employee Quarter Wise Performance Analysis Bar Graph Icon
Presenting our set of slides with Employee Quarter Wise Performance Analysis Bar Graph Icon. This exhibits information on three stages of the process. This is an easy to edit and innovatively designed PowerPoint template. So download immediately and highlight information on Employee, Quarter Wise Performance, Analysis Bar Graph.
-
Bar Graph Analysis Colored Icon In Powerpoint Pptx Png And Editable Eps Format
Give your next presentation a sophisticated, yet modern look with this 100 percent editable Bar graph analysis colored icon in powerpoint pptx png and editable eps format. Choose from a variety of customizable formats such as PPTx, png, eps. You can use these icons for your presentations, banners, templates, One-pagers that suit your business needs.
-
Bar Graph Analysis Monotone Icon In Powerpoint Pptx Png And Editable Eps Format
Make your presentation profoundly eye-catching leveraging our easily customizable Bar graph analysis monotone icon in powerpoint pptx png and editable eps format. It is designed to draw the attention of your audience. Available in all editable formats, including PPTx, png, and eps, you can tweak it to deliver your message with ease.
-
Competitors Analysis Bar Graph Colored Icon In Powerpoint Pptx Png And Editable Eps Format
Give your next presentation a sophisticated, yet modern look with this 100 percent editable Competitors analysis bar graph colored icon in powerpoint pptx png and editable eps format. Choose from a variety of customizable formats such as PPTx, png, eps. You can use these icons for your presentations, banners, templates, One-pagers that suit your business needs.
-
Competitors Analysis Bar Graph Monotone Icon In Powerpoint Pptx Png And Editable Eps Format
Make your presentation profoundly eye-catching leveraging our easily customizable Competitors analysis bar graph monotone icon in powerpoint pptx png and editable eps format. It is designed to draw the attention of your audience. Available in all editable formats, including PPTx, png, and eps, you can tweak it to deliver your message with ease.
-

Bar graph for analysis growth arrow lock pencil ppt icons graphics
Presenting bar graph for analysis growth arrow lock pencil ppt icons graphics. This Power Point template diagram has been crafted with graphic of bank and finance, bar graph and arrow icons. This PPT icon diagram contains the concept of business result analysis and growth representation. Use this PPT icon diagram for finance and business related presentations.
-

Analysis icon with silhouettes bar graph notice board
Presenting analysis icon with silhouettes bar graph notice board. This is a analysis icon with silhouettes bar graph notice board. This is a three stage process. The stages in this process are analysis, audit, investigation.
-

Situation analysis icon with bar graph and magnifying glass
Presenting this set of slides with name - Situation Analysis Icon With Bar Graph And Magnifying Glass. This is a four stage process. The stages in this process are Situation Analysis Icon, Strategic Management Icon, Marketing Plan Icon.
-

Analysis icon with bar graph
Presenting Analysis Icon With Bar Graph. The PPT also supports the standard (4:3) and widescreen (16:9) sizes. Convert this into multiple images or document formats like JPEG and PDF. It is compatible with Google Slides and MS PowerPoint. Modify the style, size, background and other attributes of the templates
-
 Bar graph analysis icon
Presenting this set of slides with name - Bar Graph Analysis Icon. This is a four stage process. The stages in this process are Analysis Icon, Investigation Icon, Survey Icon.
-
 Bar graph with icons for business analysis powerpoint slides
Presenting bar graph with icons for business analysis powerpoint slides. This Power Point template slide has been crafted with graphic of bar graph and finance icons. This PPT slide contains the concept of business and financial analysis. Use this PPT slide for business and finance related presentations.
-
 Two arrows pie bar graph business analysis ppt icons graphics
This is an engaging design for business and marketing related slides to ensure Competitiveness in market. This PPT template can be used by professionals from diverse background to present their ideas in a fashionable way. This slide is compatible with Google slides and after downloading you can use it in full version and include your company's logo or trademark for your best experience.
-
 Record pie chart gear bar graph analysis ppt icons graphics
We are proud to present our record pie chart gear bar graph analysis ppt icons graphics. This power point icon template has been crafted with graphic of four icons of record, signpost and identity card with pie chart. This PPT diagram contains the concept of result analysis and identification. Use this PPT diagram for business and management related presentations.
-
 Swot analysis product bar graph growth indication ppt icons graphics
We are proud to present our swot analysis product bar graph growth indication ppt icons graphics. Concept of SWOT analysis and growth indication has been displayed in this icon template with four business icons . Use this PPT diagram for business and management related presentations.
-
 Business analysis financial growth bar graph venn diagram ppt icons graphics
We are proud to present our business analysis financial growth bar graph venn diagram ppt icons graphics. This power point template diagram has been crafted with graphic of bar graph and Venn diagram. This PPT diagram contains the concept of financial growth and result analysis. This PPT diagram can be used for business and finance related presentations.
-
 Decay chart growth bar graph line chart data analysis ppt icons graphics
Presenting decay chart growth bar graph line chart data analysis ppt icons graphics. This Power Point template icons slide has been crafted with graphic of decay chart, bar graph and line chart icons. This icon PPT contains the concept of data analysis and management. Use this icon PPT for business and data related presentations.
-
 Three steps team financial analysis bar graph ppt icons graphics
Presenting three steps team financial analysis bar graph ppt icons graphics. This Power Point template icons slide has been crafted with graphic of three steps, bar graph and team icons. This icon PPT contains the concept of financial analysis and team management. Use this icon PPT for business and finance related presentations.
-
 Time bound report financial analysis bar graph ppt icons graphics
Presenting time bound report financial analysis bar graph ppt icons graphics. This Power Point template icons slide has been crafted with graphic of finance, bar graph and time icons. This icon PPT contains the concept of financial analysis and time management. Use this icon PPT for business and finance related presentations.
-
 Puzzle bar graph pie chart result analysis ppt icons graphics
Presenting puzzle bar graph pie chart result analysis ppt icons graphics. This Power Point icons template has been crafted with graphic of puzzle bar graph, pie chart and result icons. This icon PPT contains the concept of business result analysis .Use this icon PPT for business and marketing related presentations.
-
 Sequential growth chart bar graph line chart analysis ppt icons graphics
Presenting sequential growth chart bar graph line chart analysis ppt icons graphics. This Power Point icons template has been crafted with graphic of growth chart, bar graph and line chart icons. This icon PPT contains the concept of sequential growth analysis. Use this icon PPT for business and finance related presentations.
-
 Dollar suitcase bar graph line chart growth analysis ppt icons graphics
Presenting dollar suitcase bar graph line chart growth analysis ppt icons graphics. This Power Point icon template diagram has been crafted with graphic of dollar, suitcase and bar graph icons. This PPT diagram contains the concept of financial growth analysis. Use this icon PPT diagram for banking and finance related presentations.
-
 Business bar graph growth decline arrow analysis chart ppt icons graphics
Presenting business bar graph growth decline arrow analysis chart ppt icons graphics. This Power Point template diagram slide has been crafted with graphic of business bar graph and decline arrow icons . This PPT diagram contains the concept of business growth analysis representation. Use this PPT diagram for business and marketing related presentations.
-
 Pie chart mobile bar graph data analysis marketing strategy ppt icons graphics
Presenting pie chart mobile bar graph data analysis marketing strategy ppt icons graphics. This Power Point template diagram slide has been crafted with graphic of pie chart, mobile and bar graph icons . This PPT diagram contains the concept of business data analysis and marketing strategy. Use this PPT diagram for business and marketing related presentations.
-
 Business growth bar graph success analysis ppt icons graphics
Presenting business growth bar graph success analysis ppt icons graphics. Presenting business growth bar graph success analysis ppt icons graphics. This Power Point icons template slide has been crafted with graphic of business bar graph icons. This icon template contains the concept of business growth and success analysis. Use this PPT slide for business and marketing related presentations.
-
 Bar graph growth and decay analysis flowchart line chart ppt icons graphics
Presenting bar graph growth and decay analysis flowchart line chart ppt icons graphics. This Power Point icon template diagram has been crafted with graphic of bar graph, data and flow chart icons. This icon PPT contains the concept of result analysis and decay analysis. Use this icon PPT diagram for business and finance related presentations.
-
 Bar graph new idea generation network data analysis ppt icons graphics
Presenting bar graph new idea generation network data analysis ppt icons graphics. This Power Point icon template diagram has been crafted with graphic of bar graph, network and data icons. This icon PPT contains the concept of idea generation and data analysis decay analysis. Use this icon PPT diagram for business and finance related presentations.
-
 Business line chart bar graph growth analysis ppt icons graphics
Presenting business line chart bar graph growth analysis ppt icons graphics. This Power Point icon template diagram has been crafted with graphic of business line chart and checklist icons. This icon PPT contains the concept of financial management representation. Use this icon PPT diagram for business and finance related presentations.
-
 Bar graph analysis result display teamwork ppt icons graphics
Presenting bar graph analysis result display teamwork ppt icons graphics. This Power Point icon template diagram has been crafted with graphic of bar graph and teamwork icons. This icon PPT diagram contains the concept of business result analysis. Use this icon PPT for business and finance related presentations.
-
 Finance process line chart analysis bar graph pie graph ppt icons graphics
Presenting finance process line chart analysis bar graph pie graph ppt icons graphics. This Power Point icon template diagram has been crafted with graphic of finance, line chart and bar graph icons. This icon PPT diagram contains the concept of financial data analysis .Use this icon PPT for business and finance related presentations.
-
 Report analysis stock market book shelf business bar graph ppt icons graphics
Presenting report analysis stock market book shelf business bar graph ppt icons graphics. This Power Point icon template diagram has been crafted with graphic of business icons. This icon PPT diagram contains the concept of report analysis and stock market update representation. Use this icon PPT for business and finance related presentations.
-
 Bank bar graph business deal result analysis ppt icons graphics
We are proud to present our bank bar graph business deal result analysis ppt icons graphics. This power point icon template has been crafted with graphic of four different icons. We have used icons of bank, bar graph and business deal. Use this icon template for result analysis and business related topics.
-
 Bar graphs business result analysis ppt icons graphics
We are proud to present our bar graphs business result analysis ppt icons graphics. This power point icon template has been crafted with graphic of bar graph. This icon template contains the concept of result analysis. Use this icon template for business and marketing related presentations.
-
 Data storage bar graph analysis ppt icons graphics
We are proud to present our data storage bar graph analysis ppt icons graphics. This power point template has been crafted with graphic of disk and floppy with magnetic tape. This icon PPT contains the concept of data storage. Use this icon template for business and data related presentations.
-
 Bar graph pie chart growth arrow analysis ppt icons graphics
This slide is created for executives looking for growth and strategies analysis through bar and pie chart designs. This template contains, modifiable background, color layout, font. Relevant content with flexible data. Easily converted into PDF and JPG format. Alluring graphs for comparison as well as to illustrate the various figure. Availed for corporate people, students, and researchers.
-
 Growth bar graph chart business data analysis ppt icons graphics
We are proud to present our growth bar graph chart business data analysis ppt icons graphics. Concept of data analysis can be defined with this power point icon template diagram. This PPT diagram contains the graphic of bar graph, money and chart icons. Use this icon template for business and finance related presentations.
-
 Business bar graph financial analysis curve pie chart ppt icons graphics
Presenting business bar graph financial analysis curve pie chart ppt icons graphics. This Power Point icon template has been crafted with graphic of business bar graph , pie chart and business icons. This PPT diagram contains the concept of financial analysis. Use this icon template for business and finance related presentations.
-
 Bar graph identity card keep eye on growth analysis ppt icons graphics
Presenting bar graph identity card keep eye on growth analysis ppt icons graphics. This Power Point icon template diagram has been crafted with graphic of bar graph, identity and eye icons. This icon template diagram contains the concept of growth analysis and awareness. Use this icon template diagram for cloud technology and business related presentations.
-
 Financial analysis curve bar graph process control indication ppt icons graphics
Presenting financial analysis curve bar graph process control indication ppt icons graphics. This Power Point icon template diagram has been crafted with graphic of curve, bar graph and finance icons. This icon template diagram contains the concept of process control and result analysis. Use this icon template diagram for business and finance related presentations.
-
 Bar graph with business analysis icons flat powerpoint design
Proofing and editing can be done with ease in PPT design. Presentation slide is of utmost use to management professionals, big or small organizations and business startups. Smooth functioning is ensured by the presentation slide show on all software’s. When projected on the wide screen the PPT layout does not sacrifice on pixels or color resolution.
-
 Globe magnifier calendar bar graph analysis ppt icons graphics
We are proud to present our globe magnifier calendar bar graph analysis ppt icons graphics. Graphic of globe, bar graph and magnifier with calendar icons has been used to design this power point icon template. This icon PPT contains the concept of result analysis and search. Use this PPT diagram for global business and marketing related presentations.
-
 Math icon for analysis and bar graph
Presenting this set of slides with name Math Icon For Analysis And Bar Graph. The topics discussed in these slides are Math Icon For Analysis And Bar Graph. This is a completely editable PowerPoint presentation and is available for immediate download. Download now and impress your audience.
-
 Comparative analysis icon with bar graph and line chart
Presenting our well structured Comparative Analysis Icon With Bar Graph And Line Chart. The topics discussed in this slide are Comparative Analysis Icon With Bar Graph And Line Chart. This is an instantly available PowerPoint presentation that can be edited conveniently. Download it right away and captivate your audience.
-
 Market Analysis Bar Graph Process Icon
Introducing our Market Analysis Bar Graph Process Icon set of slides. The topics discussed in these slides are Market Analysis Bar, Graph Process Icon. This is an immediately available PowerPoint presentation that can be conveniently customized. Download it and convince your audience.
