Powerpoint Templates and Google slides for Financial Graph Icon
Save Your Time and attract your audience with our fully editable PPT Templates and Slides.
-
Financial Growth Bar Graph Objective Icon
Introducing our premium set of slides with Financial Growth Bar Graph Objective Icon Ellicudate the three stages and present information using this PPT slide. This is a completely adaptable PowerPoint template design that can be used to interpret topics like Financial Growth, Bar Graph, Objective Icon So download instantly and tailor it with your information.
-
Financial Business Planning Icon With Graph And Checklist
Introducing our premium set of slides with Financial Business Planning Icon With Graph And Checklist. Ellicudate the three stages and present information using this PPT slide. This is a completely adaptable PowerPoint template design that can be used to interpret topics like Financial Business Planning, Icon, Graph And Checklist. So download instantly and tailor it with your information.
-

Statistics graph icon showing financial forecast
Presenting our set of slides with Statistics Graph Icon Showing Financial Forecast. This exhibits information on four stages of the process. This is an easy-to-edit and innovatively designed PowerPoint template. So download immediately and highlight information on Statistics Graph Icon Showing Financial Forecast.
-

Graph comparison icon for financial ratios
Presenting our set of slides with Graph Comparison Icon For Financial Ratios. This exhibits information on three stages of the process. This is an easy to edit and innovatively designed PowerPoint template. So download immediately and highlight information on Graph Comparison Icon For Financial Ratios.
-

Graph Comparison Icon For Liquidity Financial Ratios
Presenting our set of slides with name Graph Comparison Icon For Liquidity Financial Ratios. This exhibits information on three stages of the process. This is an easy-to-edit and innovatively designed PowerPoint template. So download immediately and highlight information on Graph Comparison, Icon, Liquidity Financial Ratios.
-

Financial Record To Report Icon With Graph And Chart
Introducing our premium set of slides with Financial Record To Report Icon With Graph And Chart. Elucidate the four stages and present information using this PPT slide. This is a completely adaptable PowerPoint template design that can be used to interpret topics like Financial Record, Report, Icon, Graph, Chart. So download instantly and tailor it with your information.
-

Financial Business Plan Icon With Graph And Checklist
Presenting our set of slides with Financial Business Plan Icon With Graph And Checklist. This exhibits information on four stages of the process. This is an easy to edit and innovatively designed PowerPoint template. So download immediately and highlight information on Financial Business Plan, Icon With Graph And Checklist.
-

Safe mobile banking gowth bar graph global process flow financial growth time ppt icons graphics
Presenting safe mobile banking gowth bar graph global process flow financial growth time ppt icons graphics. This Power Point icon template has been crafted with graphic of four finance icons. This icon template contains the concept of safe mobile banking and financial growth representation. Use this icon template diagram for finance and business related presentations.
-

Financial statements icon showcasing euro and bar graph
Presenting this set of slides with name - Financial Statements Icon Showcasing Euro And Bar Graph. This is a three stage process. The stages in this process are Financial Statements Icon, Accounting Ratio Icon, Balance Sheet Icon.
-

Business analysis financial growth bar graph venn diagram ppt icons graphics
We are proud to present our business analysis financial growth bar graph venn diagram ppt icons graphics. This power point template diagram has been crafted with graphic of bar graph and Venn diagram. This PPT diagram contains the concept of financial growth and result analysis. This PPT diagram can be used for business and finance related presentations.
-

Three steps team financial analysis bar graph ppt icons graphics
Presenting three steps team financial analysis bar graph ppt icons graphics. This Power Point template icons slide has been crafted with graphic of three steps, bar graph and team icons. This icon PPT contains the concept of financial analysis and team management. Use this icon PPT for business and finance related presentations.
-

Time bound report financial analysis bar graph ppt icons graphics
Presenting time bound report financial analysis bar graph ppt icons graphics. This Power Point template icons slide has been crafted with graphic of finance, bar graph and time icons. This icon PPT contains the concept of financial analysis and time management. Use this icon PPT for business and finance related presentations.
-
 Business bar graph financial growth chart financial deal ppt icons graphics
Presenting business bar graph financial growth chart financial deal ppt icons graphics. This Power Point template slide has been crafted with graphic of bar graph and growth chart icons. This PPT slide contains the concept of financial data analysis. Use this PPT slide for business and finance related presentations.
-
 Financial growth bar graph line chart ppt icons graphics
Presenting financial growth bar graph line chart ppt icons graphics. This Power Point icons template has been crafted with graphic of growth arrow, bar graph and line chart icons. This icon PPT contains the concept of financial growth analysis. Use this icon PPT for business and finance related presentations.
-
 Collecting information financial banking operations growth graph ppt icons graphics
Presenting collecting information financial banking operations growth graph ppt icons graphics. This Power Point icon template diagram has been crafted with graphic of finance and graph icons. This icon PPT contains the concept of information collection and financial banking operation. Use this icon PPT diagram for business and finance related presentations.
-
 2413 make a financial bar graph ppt graphics icons powerpoint
We are proud to present our 2413 make a financial bar graph ppt graphics icons powerpoint. Our 2413 make a financial bar graph Ppt Graphics Icons Powerpoint are the essential beat of your lilting melody. Adorn them with your tuneful thoughts and top the charts.
-
 0214 build financial bar graph ppt graphics icons powerpoint
We are proud to present our 0214 build financial bar graph ppt graphics icons powerpoint. Think of it and be sure we have it. Our 0214 build financial bar graph Ppt Graphics Icons Powerpoint offer you the widest possible range of options.
-
 Bar graph with financial icons flat powerpoint design
Impressive use of colors and design. Eye catchy visuals. Images are of high resolution. No fear of pixilation when projected on wide screen. Compatible with large number of online and offline software options. Harmonious with numerous format options. Thoroughly editable slide. Include or exclude the content at ease. Personalize the presentation with company name and logo of yours.
-
 Bar graph laptop phone financial venn diagram ppt icons graphics
We are proud to present our bar graph laptop phone financial venn diagram ppt icons graphics. This power point icon template has been crafted with graphic of bar graph, laptop and phone with Venn diagram. This icon template contains the concept of financial analysis. Use this icon template for finance and technology application related presentations.
-
 Business bar graph financial analysis curve pie chart ppt icons graphics
Presenting business bar graph financial analysis curve pie chart ppt icons graphics. This Power Point icon template has been crafted with graphic of business bar graph , pie chart and business icons. This PPT diagram contains the concept of financial analysis. Use this icon template for business and finance related presentations.
-
 Bar graph business deal financial growth process control ppt icons graphics
Presenting bar graph business deal financial growth process control ppt icons graphics. This Power Point icon template diagram has been crafted with graphic of bar graph, business deal icons. This icon template diagram contains the concept of balance and process control with growth indication. Use this icon template diagram for cloud technology and business related presentations.
-
 Financial analysis curve bar graph process control indication ppt icons graphics
Presenting financial analysis curve bar graph process control indication ppt icons graphics. This Power Point icon template diagram has been crafted with graphic of curve, bar graph and finance icons. This icon template diagram contains the concept of process control and result analysis. Use this icon template diagram for business and finance related presentations.
-
 Financial data growth graph statistics decline graph ppt icons graphics
This PPT slide is a reliable way to present your company's financial matters and its practice related ideas. Engaging figures shown in this template can be resized and their colors can be changed according to your liking. Downloading this slide will give you access to its full version. You can be easily convert it into PDF or JPG formats.
-
 Statistical analysis growth graph financial stats pie chart ppt icons graphics
We are proud to present our statistical analysis growth graph financial stats pie chart ppt icons graphics. Concept of statistical analysis and growth has been displayed in this icon template with four icons of pie chart and finance. Use this PPT diagram for business and finance related presentations.
-
 1013 3d man with financial graphs ppt graphics icons powerpoint
We are proud to present our 1013 3d man with financial graphs ppt graphics icons powerpoint. Our 3D Man help you pinpoint your timelines. Highlight the reasons for your deadlines with their use.
-
 3d person and financial graph ppt graphics icons powerpoint
We are proud to present our 3d person and financial graph ppt graphics icons powerpoint. This PPT slide provides a wonderful graphic to impress your audience with your professional ideas that are broad based. It helps you to project your enthusiasm and single mindedness to your colleagues. .
-
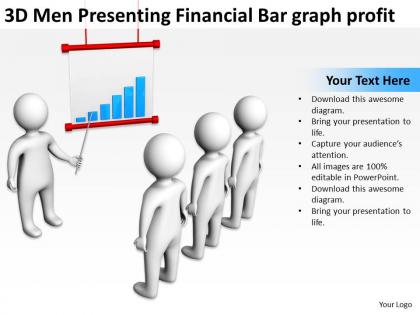 3d men presenting financial bar graph profit ppt graphic icon
We are proud to present our 3d men presenting financial bar graph profit ppt graphic icon. Like your thoughts arrows are inherently precise and true. Illustrate your plans to your listeners with the same accuracy. Show them how to persistently hit bulls? eye. Develop competitive advantage with our above Diagram which contains an image of men presenting Bar Graph to express the Financial aspects of Business.
-
 Financial performance icon with line graph
Presenting this set of slides with name Financial Performance Icon With Line Graph. This is a three stage process. The stages in this process are Financial Performance Icon With Line Graph. This is a completely editable PowerPoint presentation and is available for immediate download. Download now and impress your audience.
-
 Financial growth strategy with bar graph and money bag icon
Presenting this set of slides with name Financial Growth Strategy With Bar Graph And Money Bag Icon. This is a five stage process. The stages in this process are Grow, Develop, Network. This is a completely editable PowerPoint presentation and is available for immediate download. Download now and impress your audience.
-
 Financial icons showing stocks graph
Presenting this set of slides with name Financial Icons Showing Stocks Graph. The topics discussed in these slides are Financial Icons Showing, Stocks Graph. This is a completely editable PowerPoint presentation and is available for immediate download. Download now and impress your audience.
-
 Financial plan icon depicting pie charts graph
Presenting this set of slides with name Financial Plan Icon Depicting Pie Charts Graph. The topics discussed in these slide is Financial Plan Icon Depicting Pie Charts Graph. This is a completely editable PowerPoint presentation and is available for immediate download. Download now and impress your audience.
-
 Financial graph historical and projection net income ppt powerpoint presentation file icon
The slide provides the graph of companys financials revenue, operating income and net income for last 5 years historical and coming 4 years forecasted. Presenting this set of slides with name Financial Graph Historical And Projection Net Income Ppt Powerpoint Presentation File Icon. The topics discussed in these slides are Revenue, Operating Income, Net Income. This is a completely editable PowerPoint presentation and is available for immediate download. Download now and impress your audience.
-
 Digital process icon with currency sign and financial graph
Introducing our premium set of slides with Digital Process Icon With Currency Sign And Financial Graph. Ellicudate the one stage and present information using this PPT slide. This is a completely adaptable PowerPoint template design that can be used to interpret topics like Digital Process Icon With Currency Sign And Financial Graph. So download instantly and tailor it with your information.
-
 Organization objective icon with a financial graph
Presenting our well structured Organization Objective Icon With A Financial Graph. The topics discussed in this slide are Organization Objective Icon With A Financial Graph. This is an instantly available PowerPoint presentation that can be edited conveniently. Download it right away and captivate your audience.
-
 Fact sheet icon with financial graphs
Introducing our premium set of slides with Fact Sheet Icon With Financial Graphs. Ellicudate the three stages and present information using this PPT slide. This is a completely adaptable PowerPoint template design that can be used to interpret topics like Fact Sheet Icon With Financial Graphs. So download instantly and tailor it with your information.
-
 Analyst icon generating insights from financial modelling graphs
Presenting our set of slides with Analyst Icon Generating Insights From Financial Modelling Graphs. This exhibits information on one stage of the process. This is an easy-to-edit and innovatively designed PowerPoint template. So download immediately and highlight information on Analyst Icon Generating Insights From Financial Modelling Graphs.
-
 Financial modelling icon with investment graph
Presenting our set of slides with Financial Modelling Icon With Investment Graph. This exhibits information on one stage of the process. This is an easy-to-edit and innovatively designed PowerPoint template. So download immediately and highlight information on Financial Modelling Icon With Investment Graph.
-
 Icon indicating financial ratio analysis graph
Introducing our premium set of slides with Icon Indicating Financial Ratio Analysis Graph. Elucidate the three stages and present information using this PPT slide. This is a completely adaptable PowerPoint template design that can be used to interpret topics like Icon Indicating Financial Ratio Analysis Graph. So download instantly and tailor it with your information.
-
 Financial graph historical and projection convertible loan stock financing ppt icons
The slide provides the graph of companys financials revenue, operating income and net income for the current year and the coming 4 years forecasted. Deliver an outstanding presentation on the topic using this Financial Graph Historical And Projection Convertible Loan Stock Financing Ppt Icons. Dispense information and present a thorough explanation of Revenue, Operating Income, Net Income using the slides given. This template can be altered and personalized to fit your needs. It is also available for immediate download. So grab it now.
-
 Dices on financial graph powerpoint icon c
Microsoft PowerPoint Template and Background with dices on financial graph
-
 Dices on financial graph powerpoint icon cc
Microsoft PowerPoint Template and Background with dices on financial graph
-
 Dices on financial graph powerpoint icon f
Microsoft PowerPoint Template and Background with dices on financial graph
-
 Dices on financial graph powerpoint icon r
Microsoft PowerPoint Template and Background with dices on financial graph
-
 Dices on financial graph powerpoint icon s
Microsoft PowerPoint Template and Background with dices on financial graph
