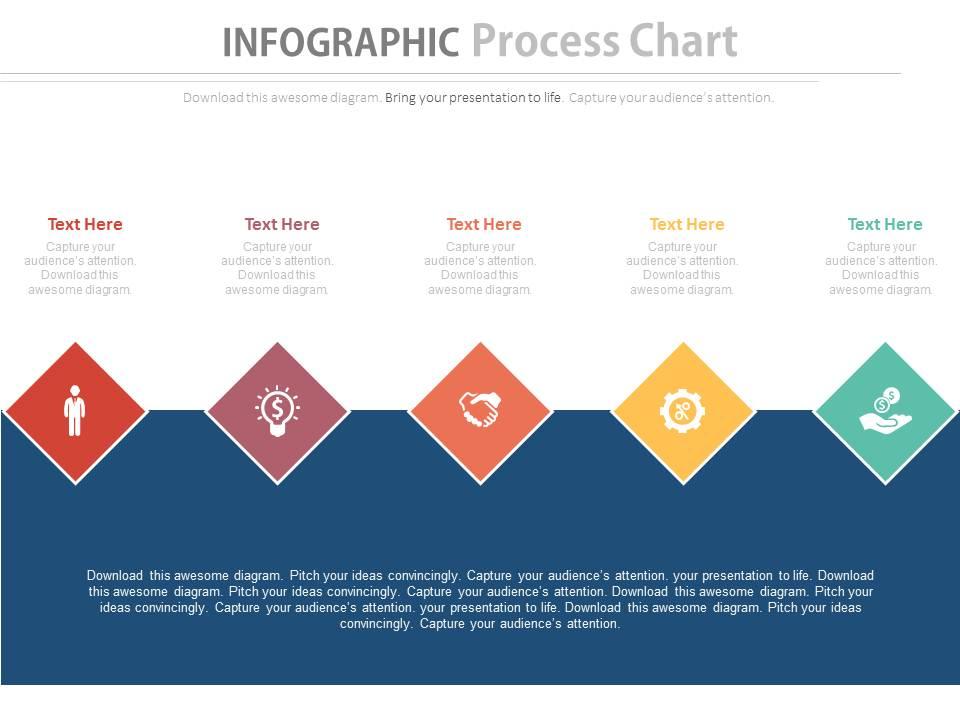
Linear infographics process chart with icons flat powerpoint design
You must be logged in to download this presentation.
Try Before you Buy Download Free Sample Product
 Impress your
 audience
Editable
of Time
SlideTeam presents you yet another quintessential design for expressing your business strategies through a PowerPoint presentation. This PowerPoint template diagram slide has been crafted with the graphic of linear info graphics and process chart diagram. This PPT diagram slide contains the concept of financial progress flow representation, professionals can use this PPT slide for business and finance related presentations. Our design team has created a 5 stages process to explain your finance agendas. Beautiful color combinations have been used here and stages have been given a visual appearance by using appropriate icons in stages, giving this PPT slide a very convenient and expressive look. A business strategy is the means by which it sets out to achieve its desired objective and this slide is getting u along for the same. Download this presentation for an everlasting experience and leave a positive impression while explaining your business agendas through this impressive PowerPoint design. Get started now. Get your due with our Linear Infographics Process Chart With Icons Flat Powerpoint Design. Convince the audience that you are deserving.
People who downloaded this PowerPoint presentation also viewed the following :
Looking for something specific? Start your search below.
Linear infographics process chart with icons flat powerpoint design with all 4 slides:
Our Linear Infographics Process Chart With Icons Flat Powerpoint Design enjoy diversity. They absorb the best from different cultures.
-
Great experience, I would definitely use your services further.
-
Best Representation of topics, really appreciable.


