Powerpoint Templates and Google slides for Analysis Icon
Save Your Time and attract your audience with our fully editable PPT Templates and Slides.
-

Data Analysis Business Key Monotone Icon In Powerpoint Pptx Png And Editable Eps Format
This monotone PowerPoint icon depicts a key, representing the importance of unlocking success in business. It is a versatile graphic that can be used to illustrate a variety of concepts, from unlocking potential to opening doors to new opportunities.
-

Document Clustering Content Analysis Colored Icon In Powerpoint Pptx Png And Editable Eps Format
This colourful PowerPoint icon is perfect for representing content analysis. It features a magnifying glass, a clipboard and a pie chart, all in bright, vibrant colours. Its a great way to illustrate your content analysis project and add a touch of colour to your presentation.
-

Document Clustering Content Analysis Monotone Icon In Powerpoint Pptx Png And Editable Eps Format
This monotone powerpoint icon is perfect for representing content analysis. It features a magnifying glass and a pie chart, making it ideal for illustrating research and data analysis.
-

Machine Learning Content Analysis Colored Icon In Powerpoint Pptx Png And Editable Eps Format
This colourful PowerPoint icon is perfect for representing content analysis. It features a magnifying glass, a clipboard and a pie chart, all in bright, vibrant colours. Its a great way to illustrate your content analysis project and add a touch of colour to your presentation.
-

Machine Learning Content Analysis Monotone Icon In Powerpoint Pptx Png And Editable Eps Format
This monotone powerpoint icon is perfect for representing content analysis. It features a magnifying glass and a pie chart, making it ideal for illustrating research and data analysis.
-

Mobile Content Analysis Colored Icon In Powerpoint Pptx Png And Editable Eps Format
This colourful PowerPoint icon is perfect for representing content analysis. It features a magnifying glass, a clipboard and a pie chart, all in bright, vibrant colours. Its a great way to illustrate your content analysis project and add a touch of colour to your presentation.
-

Mobile Content Analysis Monotone Icon In Powerpoint Pptx Png And Editable Eps Format
This monotone powerpoint icon is perfect for representing content analysis. It features a magnifying glass and a pie chart, making it ideal for illustrating research and data analysis.
-

Sentiment Content Analysis Colored Icon In Powerpoint Pptx Png And Editable Eps Format
This colourful PowerPoint icon is perfect for representing content analysis. It features a magnifying glass, a clipboard and a pie chart, all in bright, vibrant colours. Its a great way to illustrate your content analysis project and add a touch of colour to your presentation.
-

Sentiment Content Analysis Monotone Icon In Powerpoint Pptx Png And Editable Eps Format
This monotone powerpoint icon is perfect for representing content analysis. It features a magnifying glass and a pie chart, making it ideal for illustrating research and data analysis.
-

Website Page Speed Analysis Colored Icon In Powerpoint Pptx Png And Editable Eps Format
This vibrant PowerPoint icon is a great visual representation of website speed. It features a colourful wheel with a lightning bolt, indicating the speed of a website. Perfect for presentations on website performance, speed optimization, and more.
-

Website Page Speed Analysis Monotone Icon In Powerpoint Pptx Png And Editable Eps Format
This Monotone PowerPoint Icon is an ideal graphic for illustrating website speed. Its simple design and neutral colors make it easy to integrate into any presentation. Perfect for illustrating the importance of website speed in todays digital world.
-

Moderate Cost Analysis Allocation Colored Icon In Powerpoint Pptx Png And Editable Eps Format
This coloured powerpoint icon is perfect for representing Moderate Allocation. It features a bright and vibrant colour palette and a modern design that will make your presentation stand out. It is easy to use and will help you convey your message in a professional and eye-catching way.
-
 Moderate Cost Analysis Allocation Monotone Icon In Powerpoint Pptx Png And Editable Eps Format
This Monotone powerpoint icon is perfect for representing Moderate Allocation. It features a simple, balanced design in shades of gray, making it easy to integrate into any presentation. It is an ideal choice for illustrating the concept of Moderate Allocation in a professional and visually appealing way.
-
 Role In Portfolio Analysis Colored Icon In Powerpoint Pptx Png And Editable Eps Format
This colourful PowerPoint icon is perfect for illustrating the role of portfolio management in a presentation. It is a great visual aid for demonstrating the importance of portfolio management and its impact on the success of an organization.
-
 Role In Portfolio Analysis Monotone Icon In Powerpoint Pptx Png And Editable Eps Format
This Monotone Powerpoint Icon on Role in Portfolio is a great visual aid for presentations. It features a simple, yet effective design that will help you to effectively communicate your message. It is a perfect choice for any business or educational setting.
-
 Investment Analysis Graph Parameters Colored Icon In Powerpoint Pptx Png And Editable Eps Format
This coloured powerpoint icon is a visual representation of Investment Parameters. It is a great tool to help understand the complexities of the investment process and make informed decisions. It is an essential resource for any investor looking to maximize their returns.
-
 Investment Analysis Graph Parameters Monotone Icon In Powerpoint Pptx Png And Editable Eps Format
This monotone powerpoint icon is perfect for presentations on investment parameters. It features a graph, a calculator, and a dollar sign, making it a great visual aid for any business or finance-related presentation.
-
 Financial Budgeting Analysis Colored Icon In Powerpoint Pptx Png And Editable Eps Format
This coloured powerpoint icon is perfect for presentations on financial analysis, featuring a graph and a dollar sign. It is a great visual aid for any presentation and will help to illustrate your points in a professional and eye-catching way.
-
 Financial Budgeting Analysis Monotone Icon In Powerpoint Pptx Png And Editable Eps Format
This Monotone PowerPoint Icon is perfect for presentations on Financial Analysis. It features a graph with a dollar sign and a magnifying glass, conveying the importance of data analysis in financial decisions. Use it to make your presentation stand out
-
 Financial Cost Control Analysis Colored Icon In Powerpoint Pptx Png And Editable Eps Format
This coloured powerpoint icon is perfect for presentations on financial analysis, featuring a graph and a dollar sign. It is a great visual aid for any presentation and will help to illustrate your points in a professional and eye-catching way.
-
 Financial Cost Control Analysis Monotone Icon In Powerpoint Pptx Png And Editable Eps Format
This Monotone PowerPoint Icon is perfect for presentations on Financial Analysis. It features a graph with a dollar sign and a magnifying glass, conveying the importance of data analysis in financial decisions. Use it to make your presentation stand out
-
 Financial Investment Strategies Analysis Colored Icon In Powerpoint Pptx Png And Editable Eps Format
This coloured powerpoint icon is perfect for presentations on financial analysis, featuring a graph and a dollar sign. It is a great visual aid for any presentation and will help to illustrate your points in a professional and eye-catching way.
-
 Financial Investment Strategies Analysis Monotone Icon In Powerpoint Pptx Png And Editable Eps Format
This Monotone PowerPoint Icon is perfect for presentations on Financial Analysis. It features a graph with a dollar sign and a magnifying glass, conveying the importance of data analysis in financial decisions. Use it to make your presentation stand out
-
 Icons Slide Guide For Data Collection Analysis And Presentation In Market Intelligence MKT SS V
Introducing our well researched set of slides titled Icons Slide Guide For Data Collection Analysis And Presentation In Market Intelligence MKT SS V. It displays a hundred percent editable icons. You can use these icons in your presentation to captivate your audiences attention. Download now and use it multiple times.
-
 Customer Retention Analysis Colored Icon In Powerpoint Pptx Png And Editable Eps Format
This coloured PowerPoint icon is the perfect visual representation of customer retention. It features a bright blue circle with a checkmark in the middle, signifying success. Its the perfect way to illustrate the importance of customer loyalty in your presentation.
-
 Customer Retention Analysis Monotone Icon In Powerpoint Pptx Png And Editable Eps Format
This monotone PowerPoint icon is perfect for presentations on customer retention. It is a visual representation of the importance of keeping customers loyal and engaged. It can be used to illustrate strategies and tactics for improving customer loyalty and retention.
-
 Retail Market Trend Analysis Icon
Presenting our set of slides with Retail Market Trend Analysis Icon. This exhibits information on three stages of the process. This is an easy to edit and innovatively designed PowerPoint template. So download immediately and highlight information on Retail Market Trend, Analysis Icon.
-
 Data Analysis Hackers Colored Icon In Powerpoint Pptx Png And Editable Eps Format
This vibrant coloured PowerPoint icon is perfect for data hackers. It features a laptop with a magnifying glass, a chart, and a lightbulb, representing the creative and analytical process of data hacking.
-
 Data Analysis Hackers Monotone Icon In Powerpoint Pptx Png And Editable Eps Format
This monotone powerpoint icon is perfect for data hackers. It features a silhouette of a person holding a laptop with a data chart projected onto a wall. Its a great way to represent the data hacking process and the power of data analysis.
-
 Database Analysis Integration Colored Icon In Powerpoint Pptx Png And Editable Eps Format
This coloured PowerPoint icon is perfect for representing data integration. It features a colourful arrow pointing inwards, symbolising the integration of multiple data sources. Use this icon to illustrate the concept of data integration in your presentations.
-
 Database Analysis Integration Monotone Icon In Powerpoint Pptx Png And Editable Eps Format
This monotone PowerPoint icon is perfect for presentations on data integration. It features an abstract image of two arrows crossing each other, symbolizing the combining of data from different sources. The icon is simple and modern, making it easy to integrate into any presentation.
-
 Competitor Market Analysis Colored Icon In Powerpoint Pptx Png And Editable Eps Format
This colourful PowerPoint icon is a great visual aid for presenting competitor analysis. It is a perfect way to illustrate the strengths and weaknesses of competitors in the market and to compare them. It is easy to customize and can be used in any presentation.
-
 Competitor Market Analysis Monotone Icon In Powerpoint Pptx Png And Editable Eps Format
This Monotone PowerPoint icon is the perfect visual aid for your competitor analysis presentation. It is a simple yet powerful graphic that conveys the importance of understanding your competition. It is a great way to illustrate the key points of your analysis and help your audience understand the impact of your findings.
-
 Customer Competitor Analysis Colored Icon In Powerpoint Pptx Png And Editable Eps Format
This colourful PowerPoint icon is a great visual aid for presenting competitor analysis. It is a perfect way to illustrate the strengths and weaknesses of competitors in the market and to compare them. It is easy to customize and can be used in any presentation.
-
 Customer Competitor Analysis Monotone Icon In Powerpoint Pptx Png And Editable Eps Format
This Monotone PowerPoint icon is the perfect visual aid for your competitor analysis presentation. It is a simple yet powerful graphic that conveys the importance of understanding your competition. It is a great way to illustrate the key points of your analysis and help your audience understand the impact of your findings.
-
 Research Analysis Colored Icon In Powerpoint Pptx Png And Editable Eps Format
This colourful PowerPoint icon is perfect for representing research topics. It features a magnifying glass and a book, symbolizing the exploration of knowledge and information. It is an ideal choice for presentations related to research and investigation.
-
 Research Analysis Monotone Icon In Powerpoint Pptx Png And Editable Eps Format
This Monotone PowerPoint icon is perfect for presentations on research topics. It features a magnifying glass to represent the process of researching and discovering new information. It is a great way to visually represent the concept of research in a modern and professional way.
-
 Network agenda business planning data analysis ppt icons graphics
High-quality resolution of slides for a powerful display on any screen size with fully editable features in terms of colors, orientation and icon replacement. Easy text insertion with a removable watermark. Tune in with Google slides for the convenient slide show. Easy download option with a switch facility of saving the template in various file formats.
-
 Decline growth business analysis location ppt icons graphics
We are proud to present our decline growth business analysis location ppt icons graphics. Explain the concept of growth analysis has been defined in this power point template diagram. This icon PPT diagram contains the graphic of team and bar graph. Use this icon template for business and marketing related presentations.
-
 Lock data safety analysis business ppt icons graphics
We are proud to present our lock data safety analysis business ppt icons graphics. Concept of data safety analysis has been displayed in this power point icon template. This icon PPT contains the graphic of four icons folders, globe and locks. Use this icon template for data and cloud computing related presentations.
-
 Bar graph for analysis growth arrow lock pencil ppt icons graphics
Presenting bar graph for analysis growth arrow lock pencil ppt icons graphics. This Power Point template diagram has been crafted with graphic of bank and finance, bar graph and arrow icons. This PPT icon diagram contains the concept of business result analysis and growth representation. Use this PPT icon diagram for finance and business related presentations.
-
 Checklist quality check correct report analysis ppt icons graphics
Quick and easy to download in simple steps. Fully modifiable text as per the context of your presentation. Absolutely editable color scheme and contrast of PPT infographics. No change in high resolution of PPT images post editing. Add this slide seamlessly between your own slides to maximize impact. Insert your logo, company name, brand name, trademark, tagline etc.
-
 Financial cycle money growth crisis analysis ppt icons graphics
Presenting financial cycle money growth crisis analysis ppt icons graphics. This Power Point icon template has been crafted with graphic of financial cycle, money and growth icons. This icon template contains the concept of financial crisis analysis. Use this icon template for business and finance related presentations.
-
 Multiple icons for business process analysis flat powerpoint design
Presenting multiple icons for business process analysis flat powerpoint design. This Power Point template diagram has been crafted with graphic of multiple icons. This PPT diagram contains the concept of business process analysis. Use this PPT diagram for business and marketing related presentations.
-
 Swot analysis puzzle diagram and icons flat powerpoint design
Pixels don’t break even when display on widescreen. Adaptable Presentation design as can be amended easily. Flexible PPT slides as goes well with Google slides. Easy insertion of business name, logo and icon. Alike PowerPoint templates obtainable with different nodes and stages. Beneficial for Business presenters and managers.
-
 Line chart data finance analysis growth chart ppt icons graphics
Best templates design to design PPT presentations on fundamental analysis. Best for financial managers, investment planners, economists and market analysts. Have high resolution as an exceptional defining character. Manual customization option for impeccable control. Easy insertion option for name, logo etc. giving new life to your show. Fully original and professionally built template themes. Goes well with Google slides. Downloading requires just a click.
-
 Line chart with entertainment icons month based analysis powerpoint slides
Presenting line chart with entertainment icons month based analysis powerpoint slides. This is a line chart with entertainment icons month based analysis powerpoint slides. This is a three stage process. The stages in this process are financials.
-
 Swot analysis matrix with icons ppt slide styles
Presenting swot analysis matrix with icons ppt slide styles. This is a swot analysis matrix with icons ppt slide styles. This is a four stage process. The stages in this process are strengths, weaknesses, opportunities, threats.
-
 Limitation of industry analysis ppt icon
Presenting limitation of industry analysis ppt icon. This is a limitation of industry analysis ppt icon. This is a three stage process. The stages in this process are lifecycle issues, innovation and change, company differences.
-
 Cost analysis in managerial economics ppt icon
Presenting cost analysis in managerial economics ppt icon. This is a cost analysis in managerial economics ppt icon. This is a three stage process. The stages in this process are cost benefit analysis, media tactic, cost, benefit.
-
 Swot analysis comparison of two companies ppt icon
Presenting swot analysis comparison of two companies ppt icon. This is a swot analysis comparison of two companies ppt icon. This is a four stage process. The stages in this process are strengths, threats, weakness, opportunities.
-
 Linear progression analysis ppt icon
Presenting linear progression analysis PPT icon. The linear chart design template is fully compatible with Google Slides and can edit it in PowerPoint. A user may add his organization's name and tagline. Template's quality remains same, even after doing changes in it, for example, editing of color, font size, font type, and insert text according to requirement. The graph diagram slide is suitable for explaining business process analysis. You can download this template easily. The slide is compatible with other formats such as JPEG and PDF.
-
 Risk analysis icon ppt background graphics
Presenting risk analysis icon ppt background graphics. This is a risk analysis icon ppt background graphics. This is a one stage process. The stages in this process are hazard symbol, risk icon, risk management icon.
-
 Swot icons for business analysis good ppt example
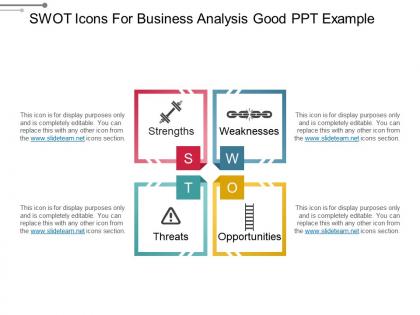
Presenting swot icons for business analysis good ppt example. This is a swot icons for business analysis good ppt example. This is a four stage process. The stages in this process are swot icons, swot analysis icon, swot matrix icon.
-
 Swot icons for organization analysis powerpoint ideas
Presenting swot icons for organization analysis powerpoint ideas. This is a swot icons for organization analysis powerpoint ideas. This is a four stage process. The stages in this process are swot icons, swot analysis icon, swot matrix icon.
-
 Swot icons showcasing business venture analysis powerpoint slide ideas
Presenting swot icons showcasing business venture analysis powerpoint slide ideas. This is a swot icons showcasing business venture analysis powerpoint slide ideas. This is a four stage process. The stages in this process are swot icons, swot analysis icon, swot matrix icon.
-
 Vendor comparison analysis ppt icon
SlideTeam would like to present to all of you its totally customizable vendor comparison analysis PPT icon. You can modify the font style, font color and even the font size of the text used. The editable nature of the slides allows you to add or insert any feature to the pre-designed template as per your requirements. The slideshow presentation can be viewed in either widescreen display ratio of 16:9 or standard size display ratio of 4:3. The template is also compatible with Google Slides.
-
 Competitor analysis competitors short term and long term goals ppt icon
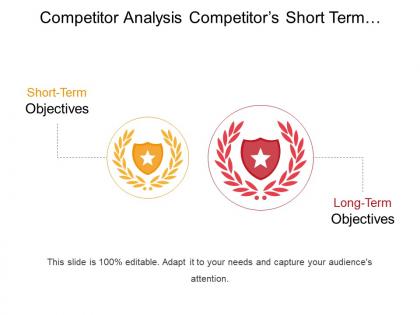
Presenting slides on Competitor Analysis Competitors Short Term And Long Term Goals PPT Icon. The visual is fully customizable to suit your requirements. The slide is 100% editable. Adapt to your needs and capture your audience’s attention. Instantly download the design with just a click. Standard and widescreen compatible slides. Can be opened using Google Slides also. Suitable for use by project managers, strategy makers, analysts etc. Premium customer support service.
-
 Business impact analysis upward graph monitoring icon
Presenting Business Impact Analysis Upward Graph Monitoring Icon which is completely editable. You can change the font, color, font size, and font types of the slides as per your needs. This template is compatible with Google Slides which makes it easily accessible at once. Open and save your presentation in various formats like PDF, JPG, and PNG. Freely access your presentation in both 4:3 and 16:9 aspect ratio.
-
 3 components performance analysis with dollar symbol icon
Presenting 3 Components Performance Analysis With Dollar Symbol Icon. The slide is 100% editable in PowerPoint and other office suites. Features such as font type, font size, colors of the diagram, and background color can be easily modified. The template is compatible with Google Slides and can be saved in multiple image formats such as JPEG, PNG or document formats such as PDF.

